Executive Summary
Philanthropy thrives when individuals and organizations are free to give, organize, and innovate with minimal interference from government. The Free to Give Index of 2026 is a comprehensive, state-by-state assessment of the policy landscape that shapes charitable giving and nonprofit activity across the United States. Drawing on thirty-three variables across 2025 data, the Index evaluates the degree to which each state’s laws, tax policies, and institutions support or hinder a robust philanthropic sector.
The Index is organized into three subindices that capture the major policies that might affect philanthropy:
- The Broad Policy Environment encompasses three measures of the general policy environment: economic freedom, tax competitiveness, and occupational freedom.
- Nonprofit Freedom includes twenty-two measures of philanthropy-specific regulations that limit people’s ability to start and run charities and solicit donations. These twenty-two measures are divided into four areas: Nonprofit start-up regulations, reporting requirements, solicitation requirements, and audit mandates.
- Donor Confidence covers eight additional policies that might affect charitable behavior. These include protections of donor intent, donor privacy, tax treatment of donations, and legal safeguards for philanthropic autonomy.
We score each state across these dimensions and report three separate measures of policy as well as an overall measure of philanthropic policy for each state.
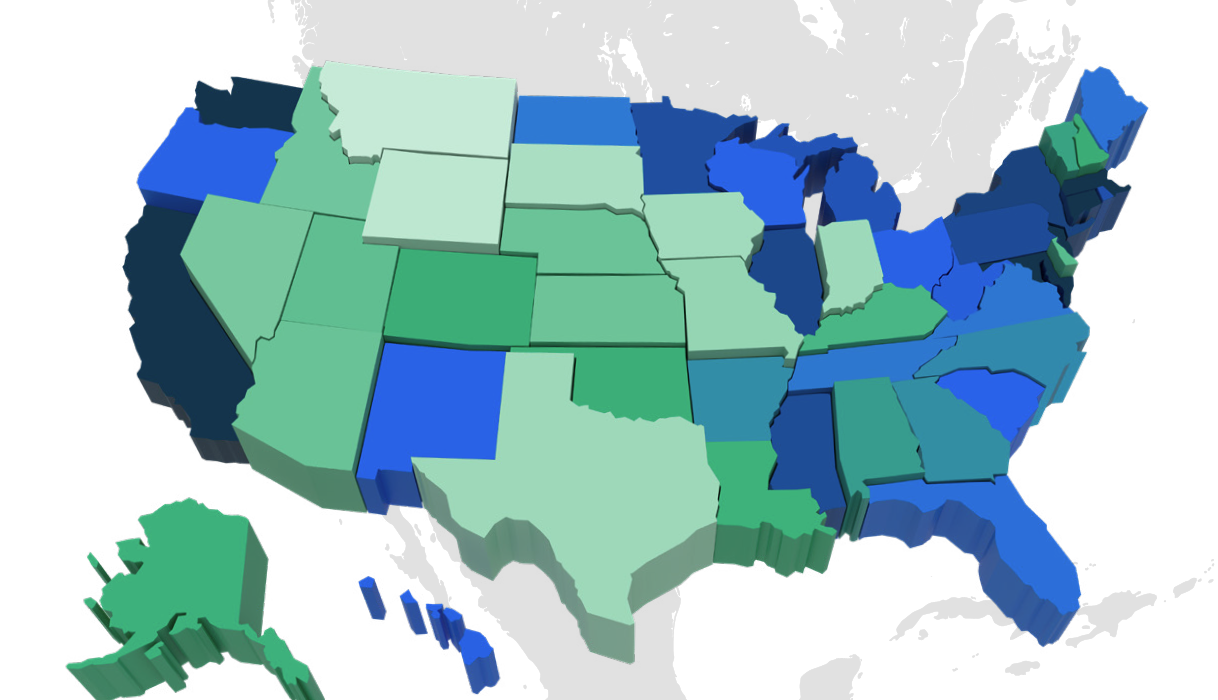
The results reveal striking differences among states. Montana, Wyoming, South Dakota, Iowa, and Indiana rank as the five most philanthropic-friendly states in 2026, offering low regulatory barriers, robust donor protections, and strong institutional respect for voluntary giving. In contrast, Connecticut, New York, Washington, New Jersey, and California impose the most burdensome or restrictive barriers to philanthropy, characterized by complex regulatory frameworks and weaker donor safeguards.
Importantly, the index can help explain variation in philanthropic activity across states. Among the bottom five states in the index, there are sixty-three charities per billion dollars of GDP. But among the top five states, there are 122 charities per billion dollars of GDP. This underscores the point that freedom in the philanthropic sphere is not a mere abstraction. These trends demonstrate that more Nonprofit Freedom and stronger incentives for philanthropy are associated with more philanthropic activity, having a positive impact on the way we live, work, and care for one another in communities across the country.
As the inaugural edition of the Free to Give Index, the 2026 report establishes a baseline for future analysis. Subsequent editions will track changes over time, allowing researchers to follow the effects of policy change over time as well as across geography. By shining a light on the policies that encourage or constrain generosity, we hope this Index informs legislators, donors, and nonprofit leaders seeking to build a more open and effective philanthropic sector nationwide.
Key Findings
- Wide Variation in Philanthropic Policy: States differ dramatically in how they treat charitable organizations and donors. Those that score the highest on our index—Montana, Wyoming, South Dakota, Iowa, and Indiana—combine economic openness, Nonprofit Freedom, and strong protection of donor rights. The lowest-ranking states— Connecticut, New York, Washington, New Jersey, and California —make it more difficult for people to make their own economic and philanthropic choices. They impose more regulatory barriers to charity, make it more difficult for donors to safeguard intent, and dull the incentive to give.
- Policy Affects Philanthropy: Those states that perform the best on our index have more charities per GDP. The top five states, for example, have nearly twice as many charities per $1 billion of GDP than do the bottom five. This suggests that the broad policy environment, nonprofit freedom, and donor confidence affect charitable formation.
- Trade-offs Matter: While certain regulations promote transparency and accountability, excessive compliance mandates limit the supply of philanthropy and divert resources from mission-related activities. All policy entails tradeoffs and this index should help policy makers better appreciate the downsides of too much charitable regulation.
- Foundations for Future Growth: This 2026 baseline enables future comparative analysis. By tracking reforms over time, such as tax policy changes, privacy protections, or regulatory simplification, the Free to Give Index will document how state-level decisions shape the evolving landscape of American philanthropy.
- Alabama
- Alaska
- Arizona
- Arkansas
- California
- Colorado
- Connecticut
- Delaware
- Florida
- Georgia
- Hawaii
- Idaho
- Illinois
- Indiana
- Iowa
- Kansas
- Kentucky
- Louisiana
- Maine
- Maryland
- Massachusetts
- Michigan
- Minnesota
- Mississippi
- Missouri
- Montana
- Nebraska
- Nevada
- New Hampshire
- New Jersey
- New Mexico
- New York
- North Carolina
- North Dakota
- Ohio
- Oklahoma
- Oregon
- Pennsylvania
- Rhode Island
- South Carolina
- South Dakota
- Tennessee
- Texas
- Utah
- Vermont
- Virginia
- Washington
- West Virginia
- Wisconsin
- Wyoming
The Free to Give Index is a comprehensive, state-by-state assessment of the policy landscape shaping charitable giving and nonprofit activity across the United States.
Each state is scored across three dimensions:
- Policy Environment — economic freedom, tax competitiveness, and occupational freedom
- Nonprofit Freedom — regulations affecting the ability to start and run charities
- Donor Confidence — donor intent, donor privacy, tax treatment, and legal safeguards
Select a state on the map or from the dropdown to see how it ranks.